I like my logs - structured and correlated
Published on Jun 2, 2025
Still using unstructured logs or plain string formats to understand your application flow? Yikes! It’s time for an upgrade.
Unstructured logs in modern observability platforms with powerful query languages are like having a sports car but only driving in first gear. They make it incredibly difficult to query logs with composite conditions and extract meaningful insights from your application’s behavior.
The Problem with Unstructured Logs
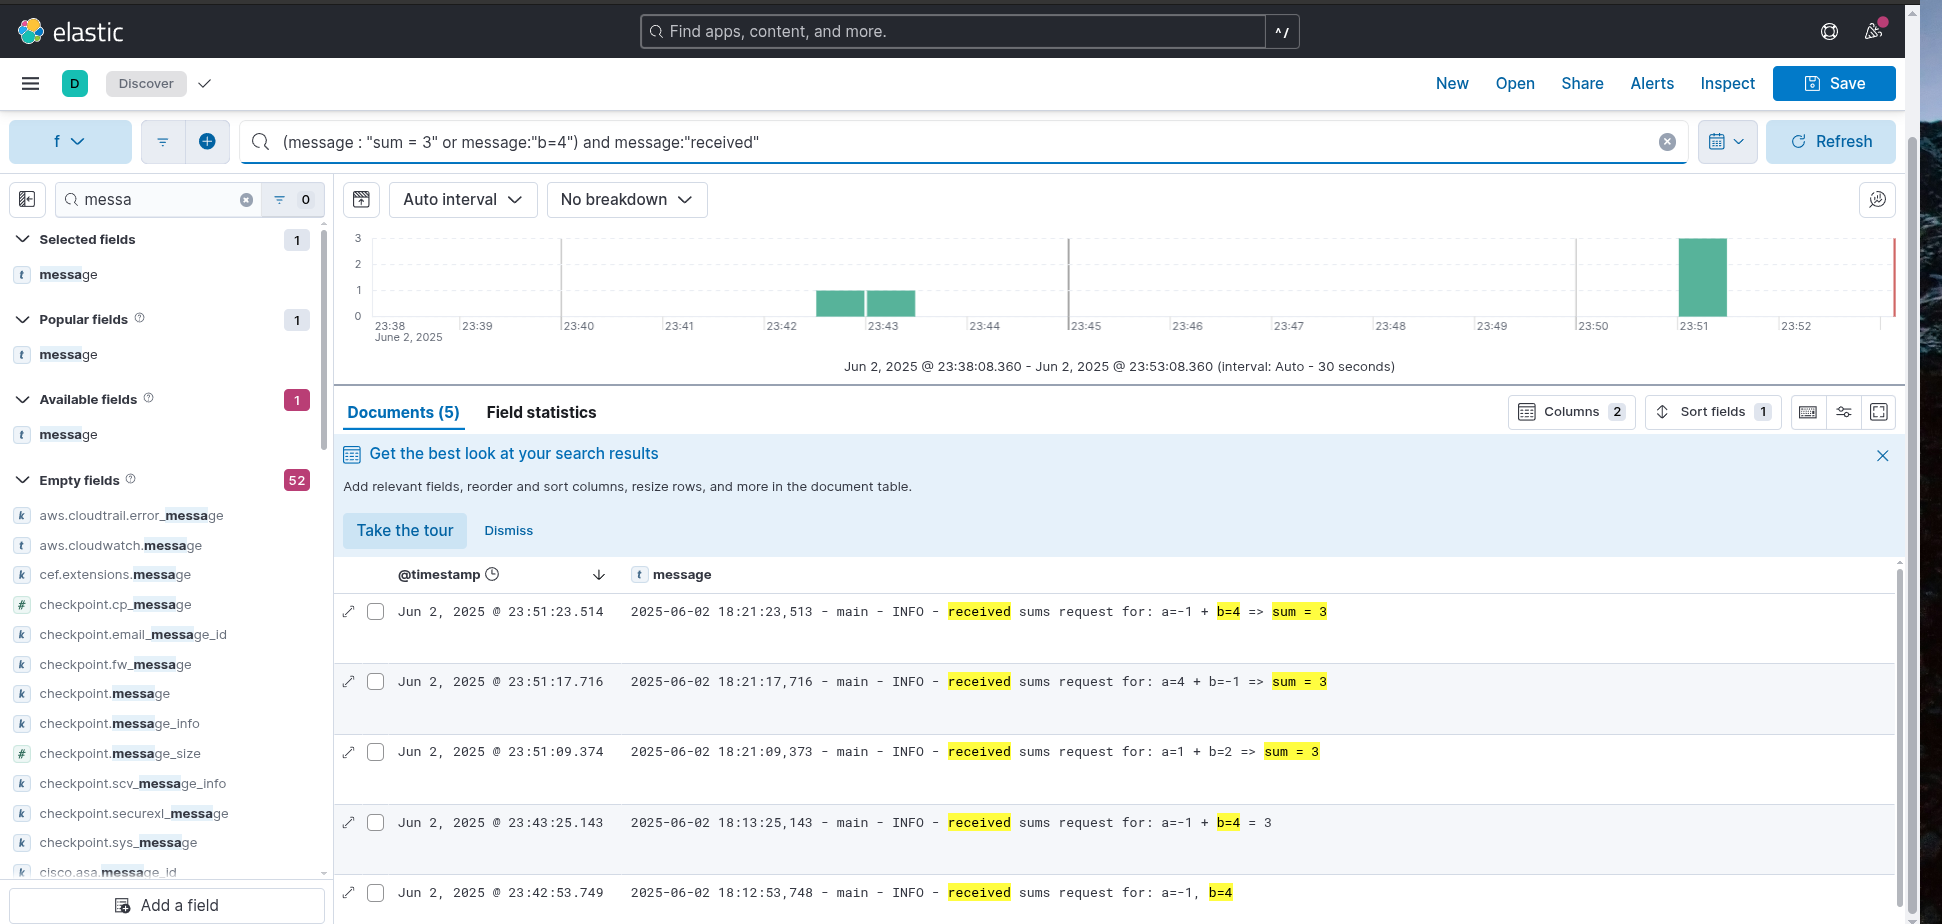
Consider this scenario: how would you query for all logs where b > 1?

With unstructured logs, you’d need to resort to complex regex patterns or string parsing—neither reliable nor maintainable.
The Power of Structure
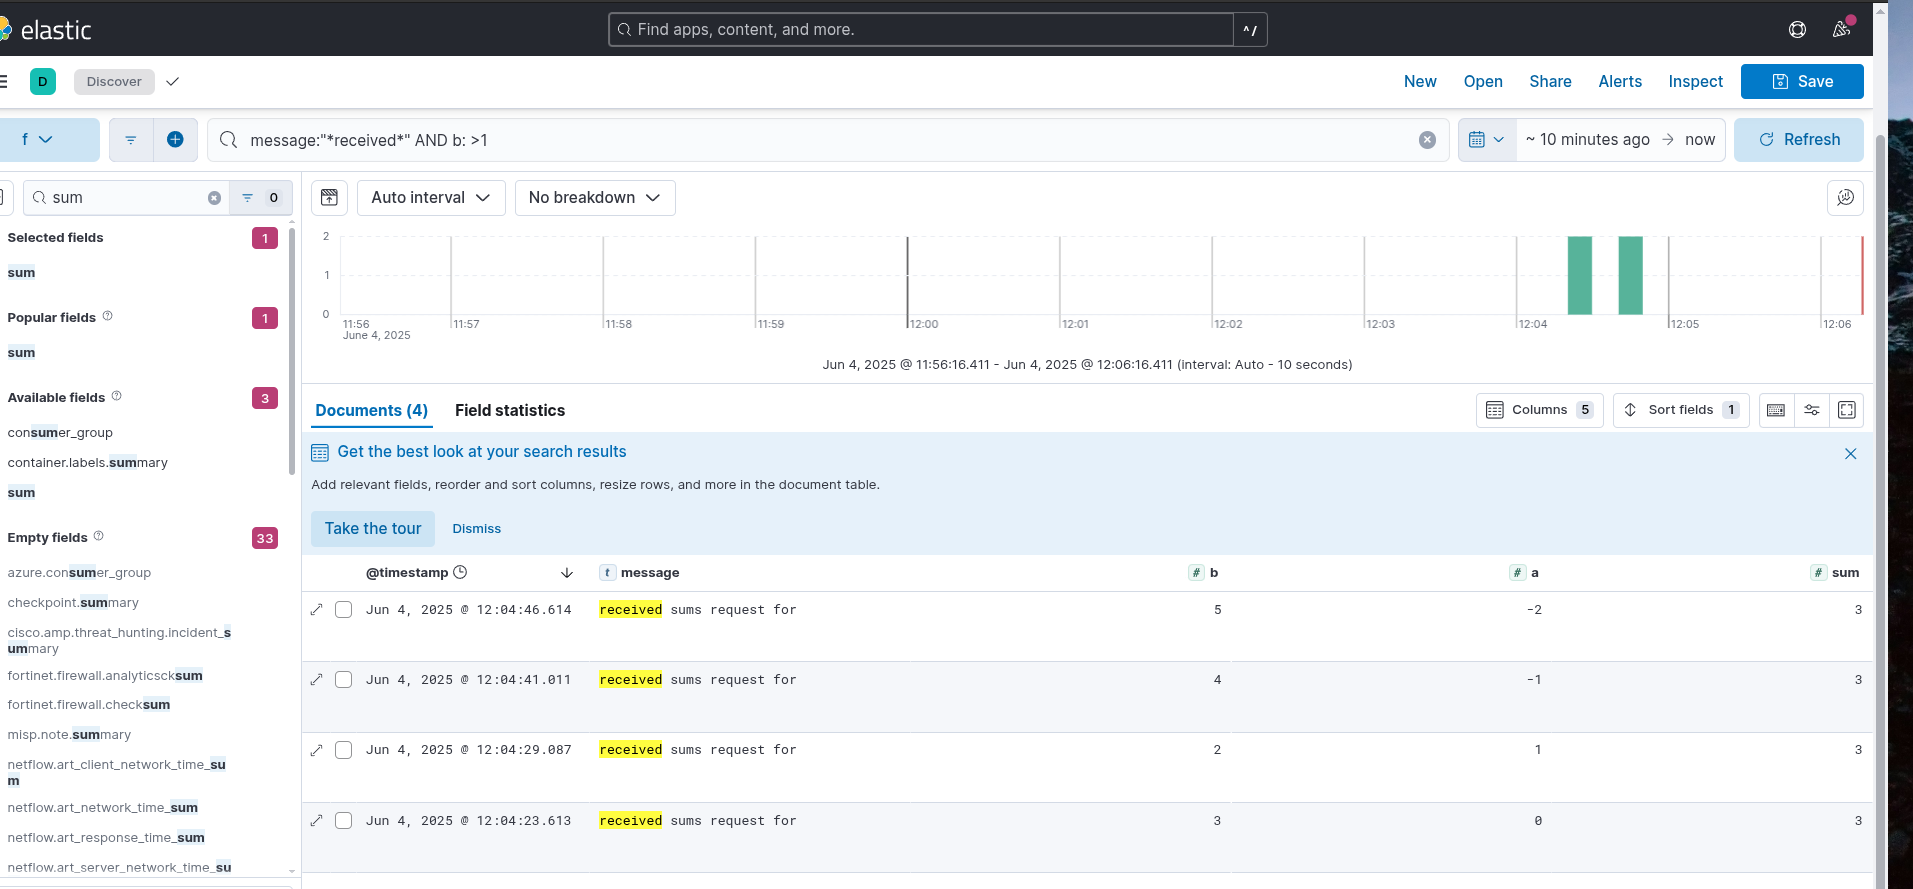
Now look at the same information in structured format:

With structured logs, you can leverage powerful query languages like Lucene to extract precise information that would be nearly impossible with plain text logs. Want all requests where b > 1 and message = “received sums request”? Easy: b:>1 AND message:"*received*".
Why Correlation Matters
Structured logs solve the “what” problem, but we also need to solve the “when” and “where” problems. In distributed systems, a single user request often generates logs across multiple services. How do you trace the complete lifecycle of that request?
The answer lies in correlated logs—logs that share common identifiers like Request ID, Trace ID, and Span ID. These identifiers form the bridge between logs and distributed tracing, bridging two of the three pillars of observability (logs, traces and metrics).
We will discuss traces and metrics some other day.
Implementation: Making It Automatic
Manually adding correlation IDs to every log statement is error-prone and tedious. Instead, let’s bake this functionality into our logging setup.
Python with FastAPI and structlog
Here’s how I implement structured, correlated logging in FastAPI applications:
from datetime import datetime
from logging import NOTSET, Logger, getLevelNamesMapping
from traceback import format_exception
from uuid import UUID

import structlog
from fastapi import Depends, Request
from fastapi.encoders import jsonable_encoder
from structlog.typing import FilteringBoundLogger
from uuid import uuid4
from opentelemetry.trace import (
    INVALID_SPAN,
    INVALID_SPAN_CONTEXT,
    get_current_span,
    get_tracer_provider,
)
from src.config import SERVICE_NAME


def get_request_id(request: Request) -> str:
    request_id = request.headers.get("X-Request-Id", "")
    if not request_id:
        request_id = str(uuid4())
    return request_id


def type_cast_to_str(logger: Logger, method_name: str, event_dict: dict) -> dict:
    provider = get_tracer_provider()

    service_name = SERVICE_NAME

    resource = getattr(provider, "resource", None)
    if resource:
        service_name = (
            resource.attributes.get("service.name") or SERVICE_NAME
        )

    if "event" in event_dict:
        event_dict["message"] = event_dict.pop("event")

    _event_dict = {}
    for k, v in event_dict.items():
        if isinstance(v, Exception) or issubclass(type(v), Exception):
            _event_dict[k] = str(v)
            _event_dict[f"{k}_traceback_dump"] = format_exception(
                type(v), v, v.__traceback__)
        else:
            _event_dict[k] = v

    span = get_current_span()
    if span != INVALID_SPAN:
        ctx = span.get_span_context()
        if ctx != INVALID_SPAN_CONTEXT:
            _event_dict["span_id"] = ctx.span_id
            _event_dict["trace_id"] = ctx.trace_id
            _event_dict["service_name"] = service_name
            _event_dict["trace_sampled"] = ctx.trace_flags.sampled

    return jsonable_encoder(_event_dict)


def add_time(logger: Logger, method_name: str, event_dict: dict):
    # * add time to log
    now = datetime.now()
    event_dict["time"] = now.strftime("%Y-%m-%dT%H:%M:%SZ")
    return type_cast_to_str(logger, method_name, event_dict)


LOG_PROCESSORS = [
    structlog.contextvars.merge_contextvars,
    structlog.processors.add_log_level,
    structlog.processors.StackInfoRenderer(),
    structlog.dev.set_exc_info,
    structlog.processors.TimeStamper(),
    structlog.processors.dict_tracebacks,
    # Add callsite parameters.
    structlog.processors.CallsiteParameterAdder(
        {
            structlog.processors.CallsiteParameter.PATHNAME,
            structlog.processors.CallsiteParameter.FUNC_NAME,
            structlog.processors.CallsiteParameter.LINENO,
        }
    ),
    add_time,
    structlog.processors.JSONRenderer(),
]


def get_logger() -> FilteringBoundLogger:
    structlog.configure(
        processors=LOG_PROCESSORS,
        wrapper_class=structlog.make_filtering_bound_logger(
            getLevelNamesMapping().get("INFO")
        ),
        context_class=dict,
        logger_factory=structlog.PrintLoggerFactory(),
        cache_logger_on_first_use=False,
    )
    return structlog.get_logger()


def get_request_logger(
    request_id: UUID = Depends(get_request_id),
) -> FilteringBoundLogger:
    def log_processor(logger: Logger, log_method: str, event_dict: dict):
        event_dict["request_id"] = str(request_id)

        return type_cast_to_str(logger, log_method, event_dict)

    _log_processors = [*LOG_PROCESSORS]
    _log_processors.insert(-2, log_processor)

    structlog.configure(
        processors=_log_processors,
        wrapper_class=structlog.make_filtering_bound_logger(
            getLevelNamesMapping().get("INFO")
        ),
        context_class=dict,
        logger_factory=structlog.PrintLoggerFactory(),
        cache_logger_on_first_use=False,
    )
    return structlog.get_logger()
To use this logger, simply inject get_request_logger as a FastAPI dependency. This setup uses structlog for structured logging and automatically includes OpenTelemetry trace information.
Go with Gin and Zerolog
The Go implementation is more straightforward thanks to zerolog’s excellent context integration:
package config

import (
	"github.com/gin-gonic/gin"
	"github.com/rs/zerolog"
	"github.com/rs/zerolog/log"
	"go.opentelemetry.io/otel/trace"
)

const (
	CorrelationRequestID = "req_id"
)

type CorrelationHook struct{}

func (h CorrelationHook) Run(e *zerolog.Event, level zerolog.Level, msg string) {
	ctx := e.GetCtx()

	if c, ok := ctx.(*gin.Context); ok {
		if reqID, ok := c.Get(CorrelationRequestID); ok {
			if reqStrID, ok := reqID.(string); ok {
				e.Str("request_id", reqStrID)
			}
		}
		ctx = c.Request.Context()
	}

	span := trace.SpanFromContext(ctx)

	if span.SpanContext().HasTraceID() {
		e.Str("trace_id", span.SpanContext().TraceID().String())
	}

	if span.SpanContext().HasSpanID() {
		e.Str("span_id", span.SpanContext().SpanID().String())
	}

}

func GetLogger() *zerolog.Logger {
	hookedLogger := log.Hook(CorrelationHook{})
	return &hookedLogger
}
To ensure the request ID is available in the context, add this middleware:
r.server.Use(
  otelgin.Middleware(
    config.ServiceName,
  ),

  func(ctx *gin.Context) {
    reqID := ctx.Request.Header.Get("X-Request-Id")
    if reqID == "" {
      reqID = uuid.NewString()
    }

    ctx.Set(config.CorrelationRequestID, reqID)

    ctx.Next()
  },
)
With zerolog's context integration, this setup automatically includes request_id, trace_id, and span_id in all logs as long as they’re part of the context.
The Payoff
This logging setup investment pays dividends when you need to debug issues in production. Instead of grepping through gigabytes of unstructured logs, you can precisely query for the information you need:
Find all errors for a specific request: request_id:"abc123" AND level:"error"
Trace a request across services: trace_id:"def456"
Analyze performance patterns: duration:>1000 AND endpoint:"/api/users"
Your future self (and your teammates) will thank you for making logs searchable, traceable, and actionable.